
Cisco Visual Networking Index (VNI) is giving strong signals to telecoms to increase their Capex and focus on several aspects, in addition to capacity.
Annual Internet Protocol (IP) traffic will triple or 23 percent CAGR between 2014 and 2019 to 2 zettabytes, said Cisco Visual Networking Index – driven by the increase in Internet users, personal devices and machine-to-machine (M2M) connections, faster broadband speeds, and the adoption of video services.
IP traffic will reach 168 exabytes per month by 2019 against 59.9 exabytes per month in 2014.
# Telecom operators need to fine tune their strategy to handle the unprecedented data traffic. Cisco said telecoms need enhanced security and intelligence to authenticate to gain access for devices — tablets, smartphones and M2M connections — to fixed/mobile networks. Increased bandwidth capacity is not the only requirement in the next half decade, said Cisco.
# The advanced video services (e.g., HD/ultra HD video, spherical video) and M2M applications will create new bandwidth and scalability requirements for telecoms. Residential, business and mobile consumers will demand for advanced video services across all network and device types. Since the quality, convenience, and price will be the key factors for success, telecoms need to invest more in networks.
# Business video adoption (i.e., HD and web-based video conferencing and business VoD) may prompt greater growth in network virtualization and leveraging the Internet for video transmission (network ramifications for SPs/OTTPs).
# By 2019, more than 14 percent of monthly global IP traffic will come from cellular connections and 53 percent of monthly IP traffic will come from Wi-Fi connections (i.e., more than two-thirds or 67 percent of total monthly IP traffic), said Cisco. Differentiated and monetizable mobile strategies will be important for all telecoms.
# Cisco said IP networks must be intelligent and flexible enough to support the constant introduction of new/updated applications for fixed and mobile networks. Many SPs are actively collaborating with application and content developers to differentiate their services.
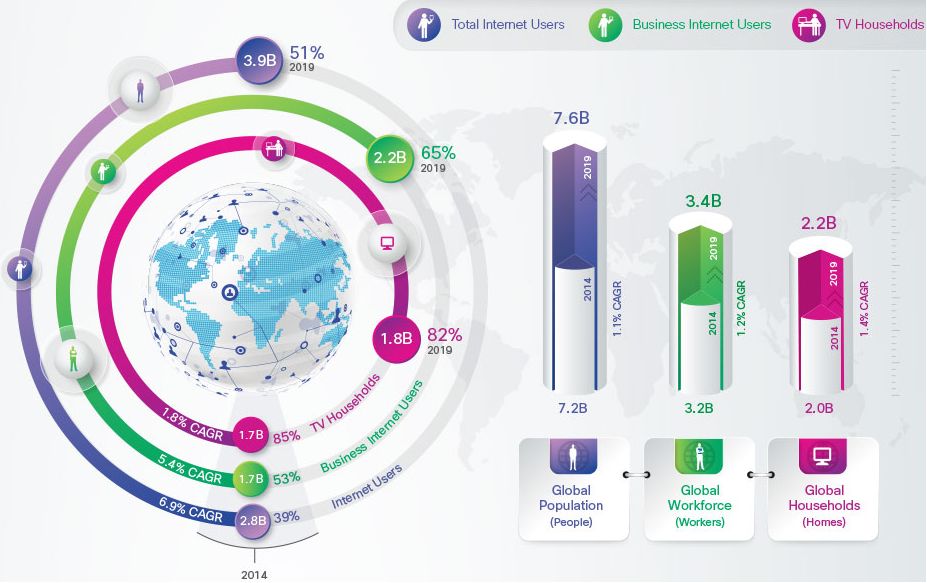
There will be about 3.9 billion Internet users, or 51 percent of the world’s projected population of 7.6 billion by 2019 against 2.8 billion Internet users, or 39 percent of the world’s population of 7.2 billion in 2014.
There will be 24 billion networked devices/connections online by 2019 against 14 billion in 2014 – including tablets, smartphones, and Internet-enabled ultra-high definition (UHD) TVs, as well as M2M connections and wearables including new smart watches, health monitors, etc.
There will be 3.2 networked devices/connections per capita by 2019 against 2 per capita in 2014.
41 percent of all fixed and mobile networked devices/connections will be IPv6-capable by 2019 against 22 percent in 2014. The average fixed broadband speed will increase two-fold from 20.3 Mbps in 2014 to 42.5 Mbps in 2019. Year-over-year, the average global fixed broadband speed grew 26 percent from 16 Mbps in 2013 to 20.3 Mbps in 2014.
Western Europe and Asia Pacific continue to lead the world in fixed broadband network speeds. By 2019, 33 percent of all global fixed broadband connections will be faster than 25 Mbps against 29 percent today.
IP video will account for 80 percent of all IP traffic by 2019 against 67 percent in 2014 – fuelled by demand by residential, business and mobile consumers.
By 2019, more than 14 percent of monthly IP traffic will derive from cellular connections, and 53 percent of monthly IP traffic will come from Wi-Fi connections.
Wi-Fi and mobile connected devices will generate 67 percent of IP traffic by 2019 — Wi-Fi: 53 percent and cellular: 14 percent — compared with fixed traffic, which will account for 33 percent of overall traffic.
In 2014, fixed traffic accounted for 54 percent of IP traffic, while Wi-Fi accounted for 42 percent and cellular 4 percent. By 2019, the highest traffic-generating countries will be the U.S. (45.7 exabytes/month) and China (21.9 exabytes/month).
South Africa and Saudi Arabia will have the highest IP traffic growth rate with a 44 percent CAGR from 2014 to 2019. Following will be Indonesia (36 percent CAGR) and India (33 percent CAGR) over the forecast period.
By 2019, more than 14 percent of monthly global IP traffic will come from cellular connections and 53 percent of monthly IP traffic will come from Wi-Fi connections.
Baburajan K
[email protected]


